728x90
반응형
첫 번째 시도
def solution(rectangle, characterX, characterY, itemX, itemY):
    graph = [[0] * 51 for _ in range(51)]
    move = [(0, 1), (0, -1), (-1, 0), (1, 0)]
    for rec in rectangle:
        x1, y1, x2, y2 = rec
        for x in range(x1, x2 + 1):
            for y in range(y1, y2 + 1):
                graph[x][y] = 1
    visited = [[False] * 51 for _ in range(51)]
    Q = deque()
    Q.append((0,0))
    visited[0][0] = True
    border = deque()
    while Q:
        x, y = Q.popleft()
        for dx, dy in move:
            nx = dx + x
            ny = dy + y
            if 0 <= nx < 51 and 0 <= ny < 51 and not visited[nx][ny]:
                visited[nx][ny] = True
                if graph[nx][ny] == 1:
                    border.append((nx, ny))
                else:
                    Q.append((nx, ny))
    x, y = zip(*border)
    plt.scatter(x, y)
    plt.show()
테두리만 저장을 하기위에
먼저 1을 만나면 테두리 리스트로 넣으려고 했다.
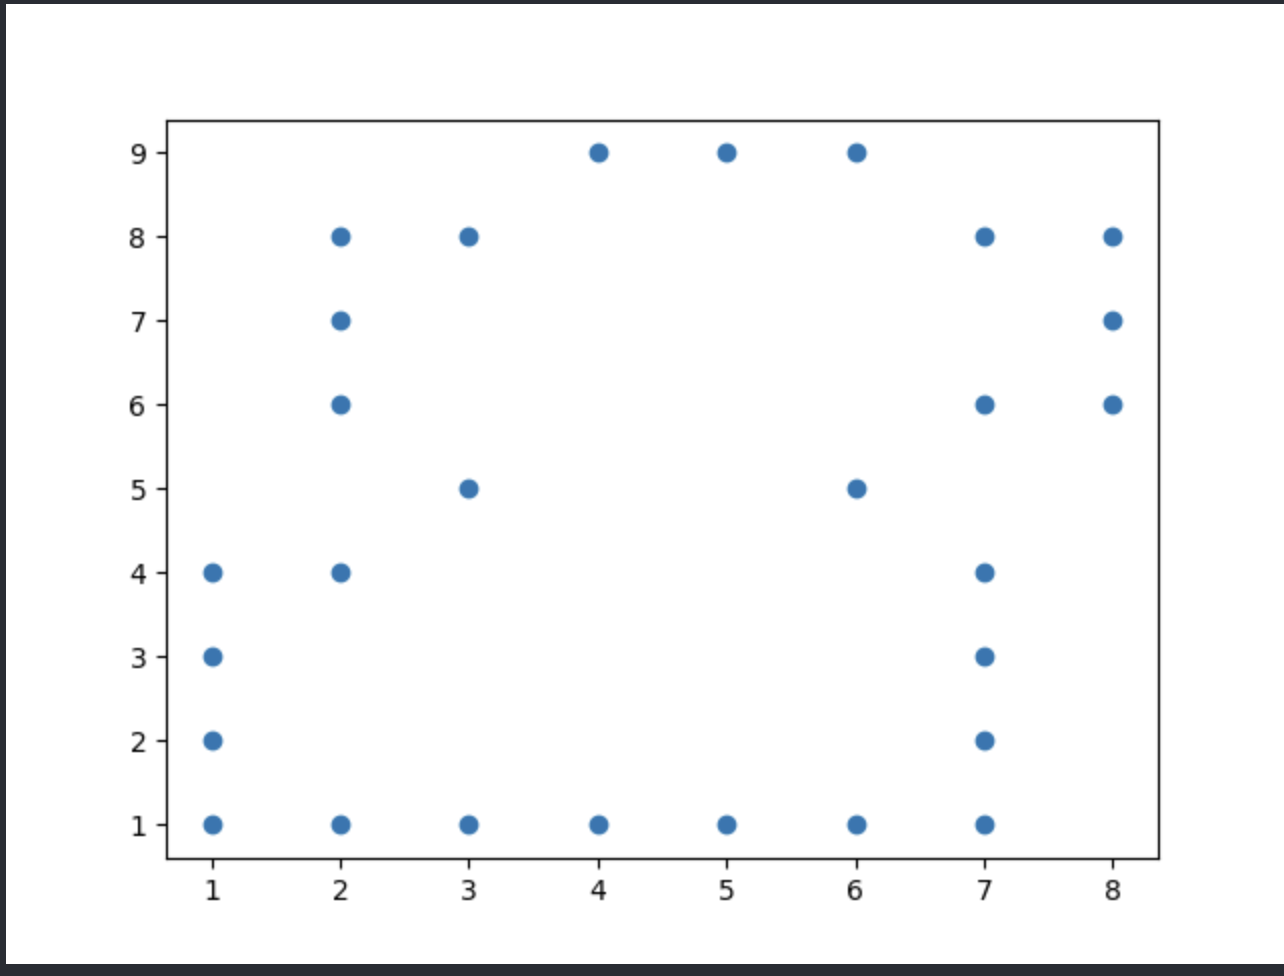
하지만 시각화를 해보니 (3,4) (3,6) 등이 안 들어간다. 그래서 다른 방법으로 해야한다.
정답 코드:
from collections import deque
import matplotlib.pyplot as plt
import numpy


def solution(rectangle, characterX, characterY, itemX, itemY):
    graph = [[-1] * 102 for _ in range(102)]
    move = [(0, 1), (0, -1), (-1, 0), (1, 0)]
    for rec in rectangle:
        x1, y1, x2, y2 = map(lambda x: x * 2, rec)
        for x in range(x1, x2 + 1):
            for y in range(y1, y2 + 1):
                # 속 색칠
                if x1 < x < x2 and y1 < y < y2:
                    graph[x][y] = 0
                # 테두리  색칠
                elif graph[x][y] != 0:
                    plt.scatter(x, y)
                    graph[x][y] = 1
    plt.show()

    characterX = characterX * 2
    characterY = characterY * 2
    itemY = itemY * 2
    itemX = itemX * 2

    Q = deque()
    Q.append((characterX,characterY))
    visited = [[1] * 102 for _ in range(102)]
    visited[characterX][characterY] = 0

    while Q:
        x, y = Q.popleft()
        if x == itemX and y == itemY :
            print(visited[x][y] // 2)
            break
        for dx, dy in move:
            nx = dx + x
            ny = dy + y
            if 0 < nx <= 102 and 0 < ny <= 102 and graph[nx][ny] == 1 and visited[nx][ny] == 1:
                Q.append((nx, ny))
                visited[nx][ny] += visited[x][y]

print(solution([[1, 1, 7, 4], [3, 2, 5, 5], [4, 3, 6, 9], [2, 6, 8, 8]], 1, 3, 7, 8))  # 17
길이를 2배씩 늘려주어야, 정확하게 최단거리로 갈 수 있다.
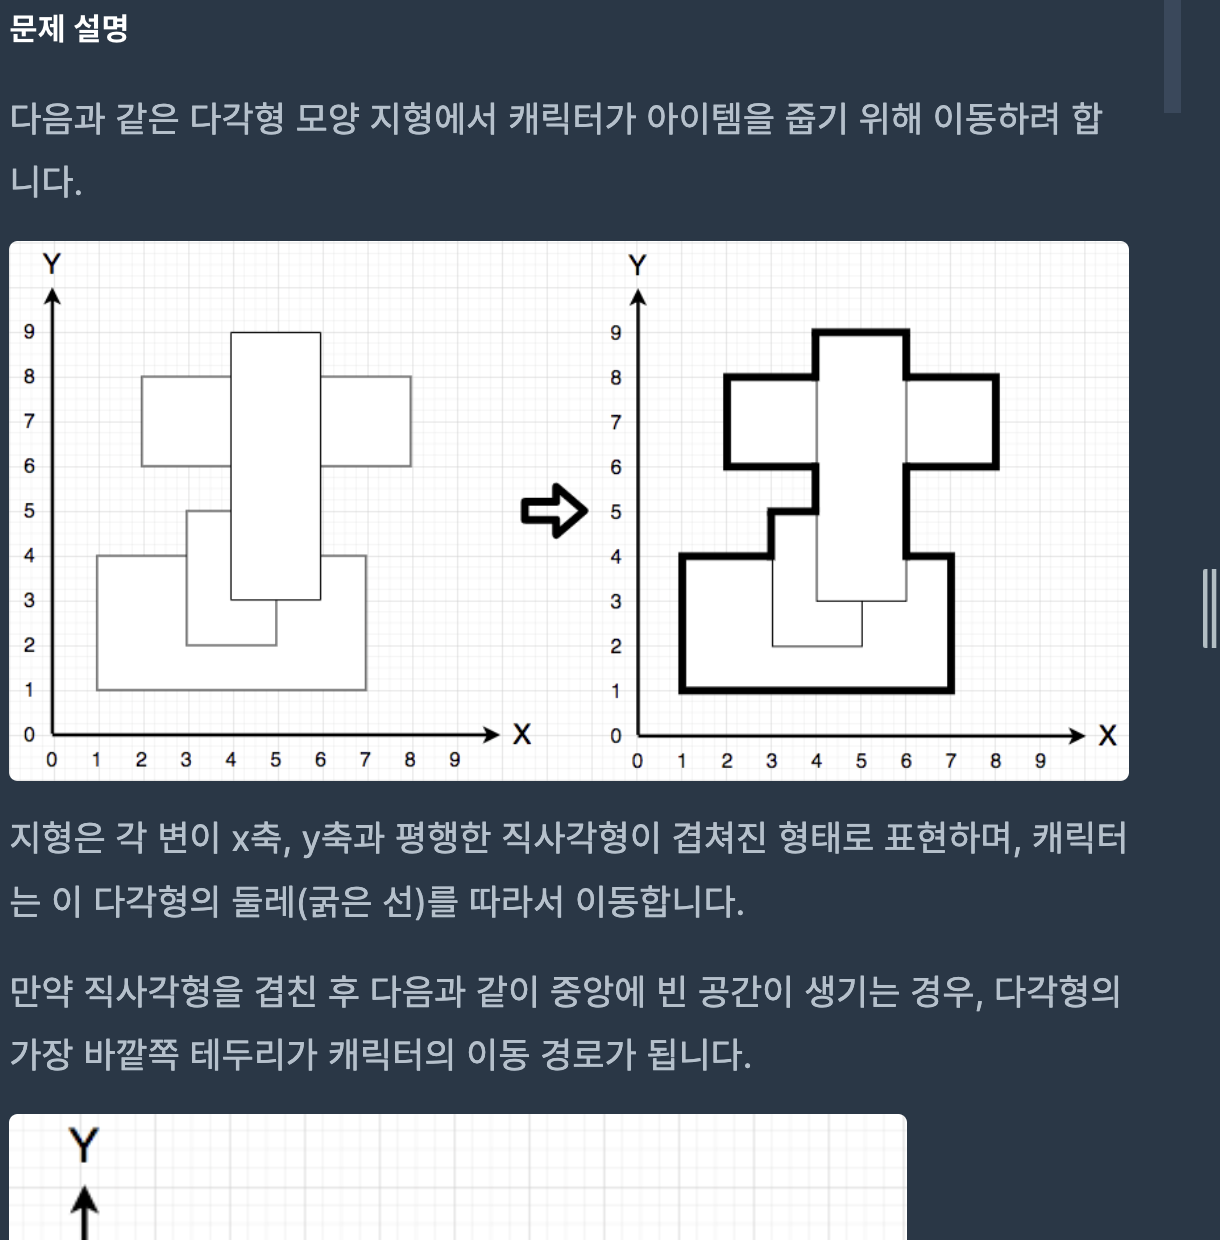
맨 위에 그림으로 보면
(3,6)(4,6) (3,5),(4,5) 에서 바로 35에서 35로 넘어가기 떄문에 길이를 2배를 해줘서
바로 못가게 해줘야한다.
반응형


댓글